Forecasting and what-if analysis features are the advanced built-in machine learning algorithms Amazon Quicksight. With a few simple clicks, we can apply these algorithms to the datasets and make them available in the dashboard.
Anomalies in the data are automatically excluded by Amazon QuickSight from having an impact on the projection. Additionally, interactive what-if analysis can be done with ML-powered forecasting to identify the growth trajectory required to accomplish corporate objectives. Let’s dive into the concepts.
Forecasting:
Following are some of the steps to add forecasts to your visuals in the Amazon Quicksight.
- To create a forecast, it is necessary for us to have a date dimension and measure but you can add up to three measures in the visual. For instance, in the following visual we have the order date as a dimension and the order id as a measure.
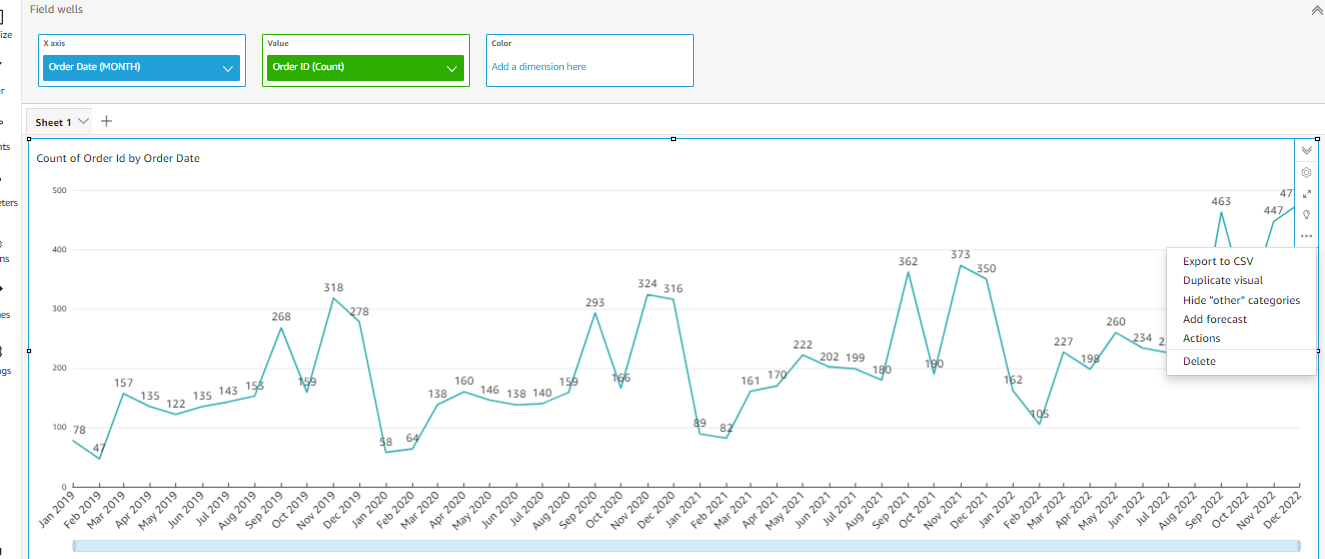
- Then, after toggling the two down-ward arrows, you will see a bunch of options where you have to choose the option with the three dots and you will have a pop-up with options having Add forecast.
- Choose add forecast option on the pop-up, now you will see the changes on your visual that show the forecast for the next 14 periods because by default QuickSight automatically analyses the past data and presents a graphical forecast for the subsequent 14 periods using the inbuilt machine learning algorithm.

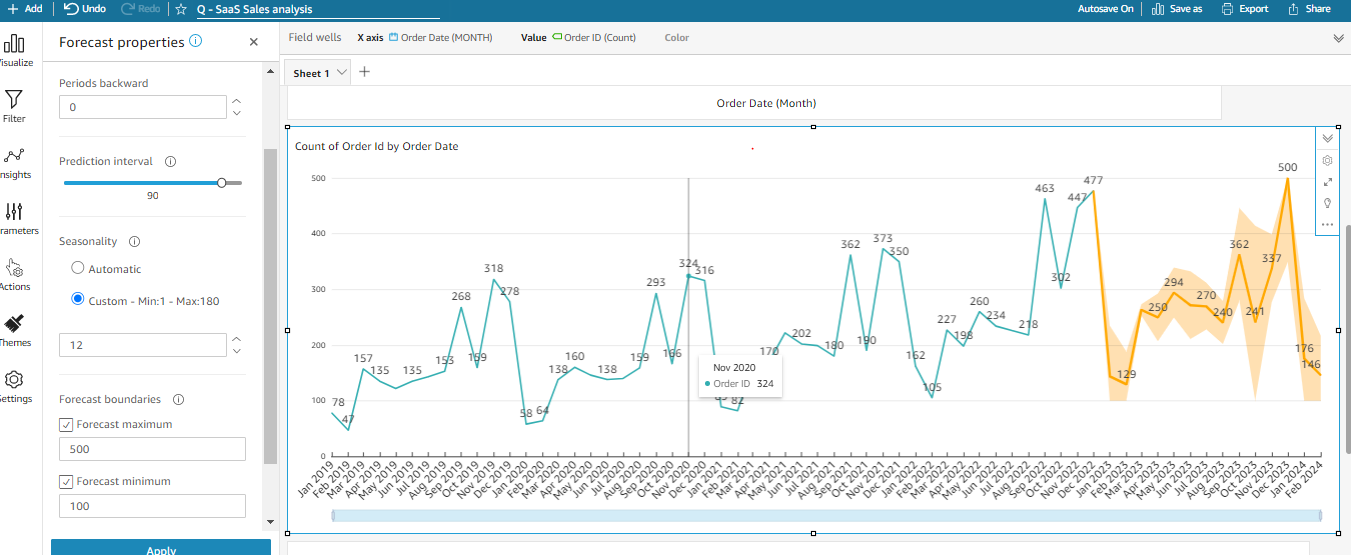
- Period Forward represents the periods to set for the future periods whereas Period backward is to set periods for the past, basically, it is a way to find out how well the forecasting is performed by applying the model to the previous periods.

- Prediction Interval sets the forecasting range. By altering the prediction interval, the size of the possible range surrounding the forecast line is altered. For instance, in the following graphical representation when the prediction interval is set to 50, the upper and lower bound of the expected forecast values is narrowing down.
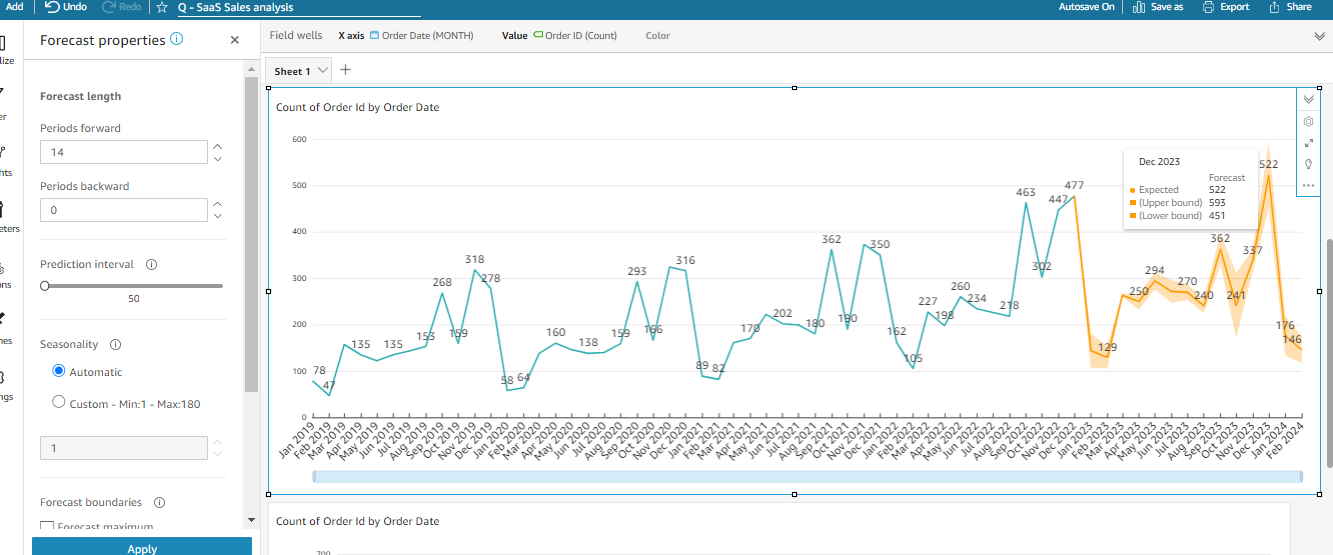
- Seasonality decides how many time periods the data’s predictable seasonal pattern spans. The automatic setting is the default, and the range is 1-180.
For instance, in my case, the following graph’s seasonality is 12 because the values are shown by the month and we have a drop at the end of every year. If you are having it by days, then you can go head by week. However, in most cases, Quicksight takes care of the seasonality automatically as the automatic option is selected by default but in some cases, we might have to pass in the time period range to get the meaningful seasonality graph.
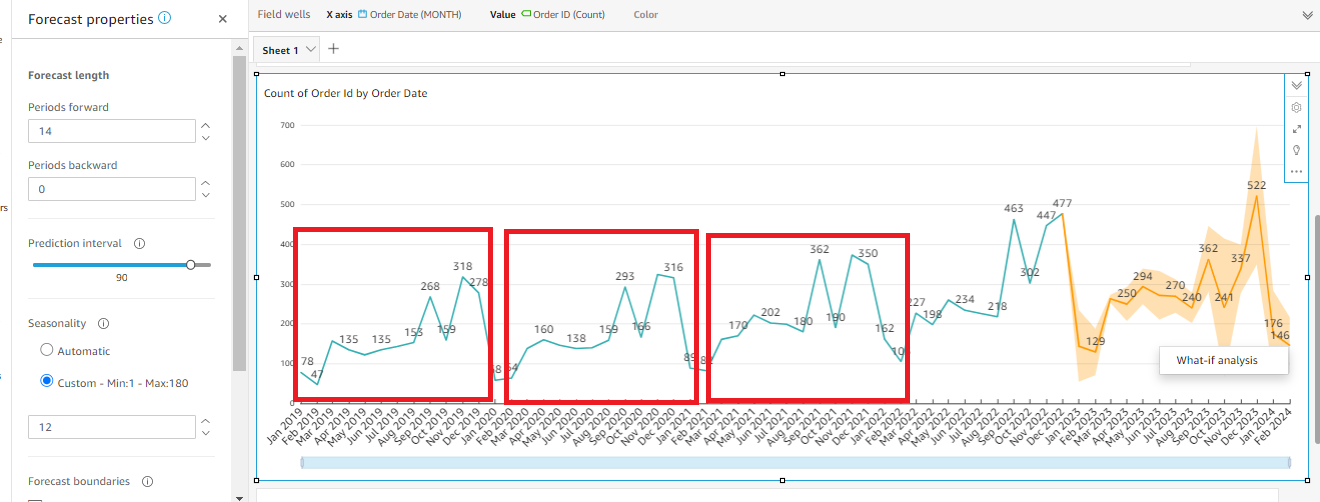
- Forecast boundaries allow us to set the minimum and maximum forecast values to stop the value from going above or below the specified range. As you can see from the following graph, we are setting the maximum forecast as 500, and the minimum forecast as 100, after applying it to the visual, the upper and lower bounds of forecast values are not going beyond 500 or below 100.
Then apply to save the changes.
What-if analysis:
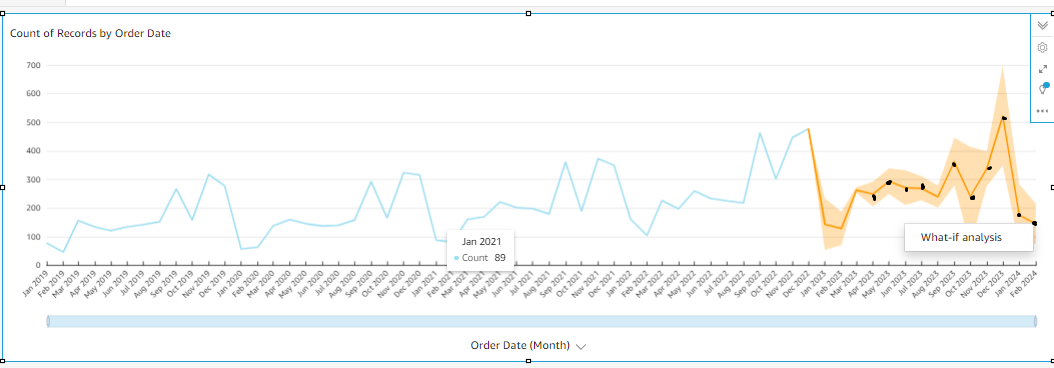
What-if analyses are applied to the forecasted periods of the forecasting visual. If you right-click on one of the forecasting points, it gives you a tiny pop-up where it says what-if analysis. The following picture is for your reference.
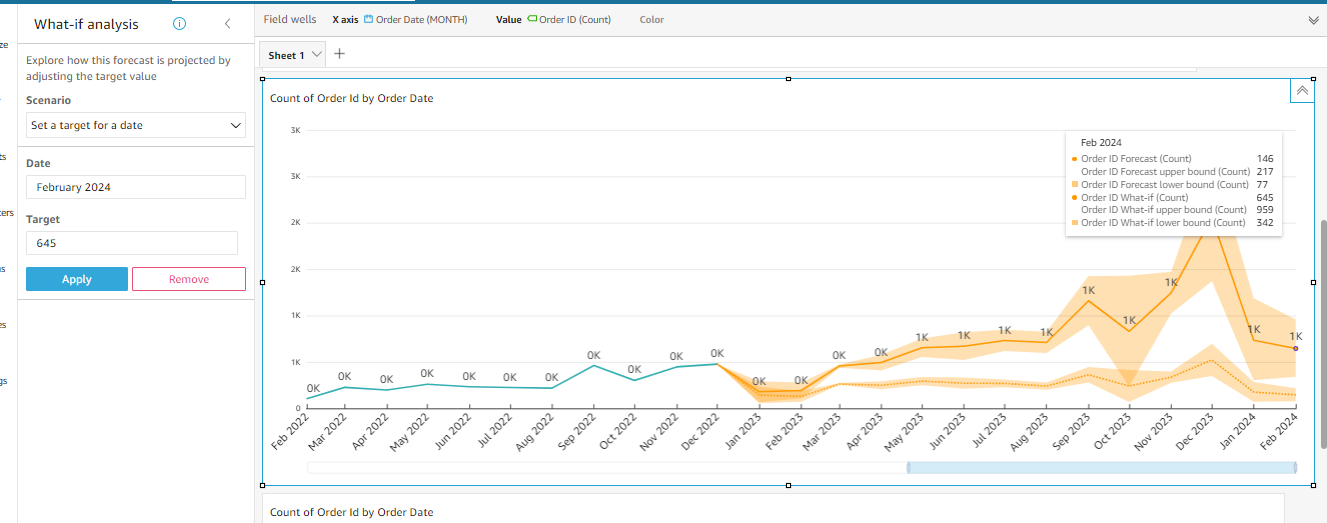
- After you click the what-if analysis pop-up, you will see a new window on your left with the name what-if analysis and will have the scenario, date, and target as options.
- If you choose to set a target for a date in the scenario, you will have one date to choose and that would be one of the periods of your forecasted values.
In my case, I applied the what-if analysis for February 2024 and I set the target as 645. The top line of the visual is the what-if analysis line and the bottom one is the actual forecast line. As you can see the what-if analysis line, has adjusted the entire forecast values according to the target (645) we set for February 2024.
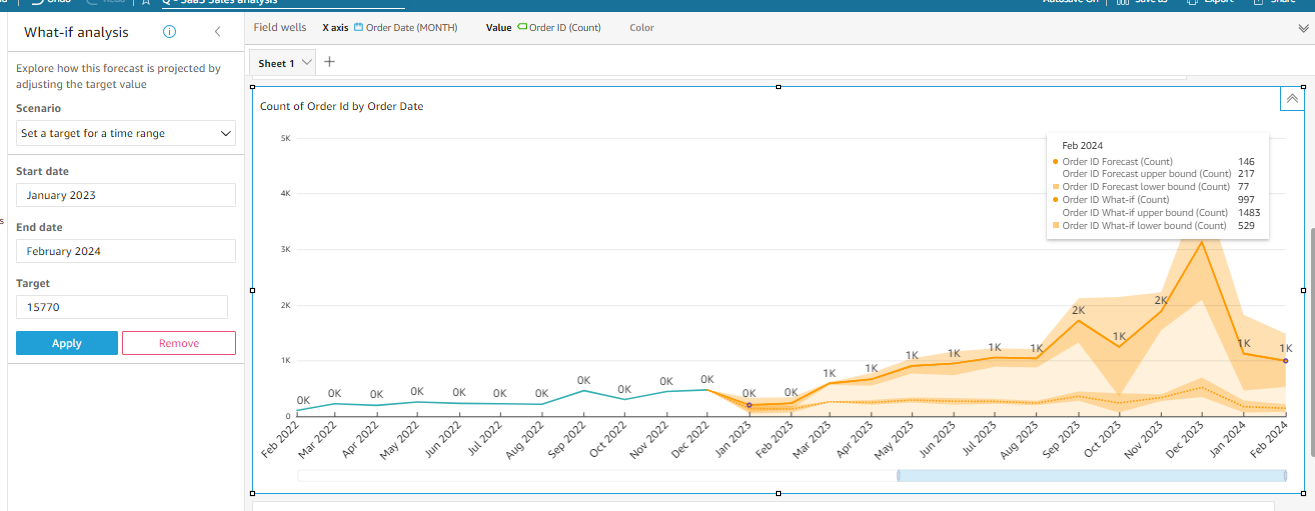
- Then, Choosing set a target for a time range in the scenario drop-down would give the start date and end date to select the range of dates and the target is going to be the sum of the entire range. For example, if you are setting the range from January 2024 to February 2024, then the target is going to be the addition of the two months, after which you click and the entire forecast values are going to adjust according to the target value set for the range
In addition, what-if analysis can also be removed from the visual after clicking the dot on the metric line for which have created what-if analysis. You can also create additional what-if analysis, but to do so you have to close the existing one.
Learning is what makes me excited. I have a handful of experience as a data and BI analyst with broad skills across various tools. I am also a person who take up challenges and who work for it untill it get resolved. I have learnt to be spontaneous and precision in problem solving because of the experience over the years.