
The range slider in QuickSight is an advanced feature that enables users to select a range by sliding controls from left to right. This feature can be added to the filter control with a few configurations in the filter pane. Unlike standard sliders, which are usually linked to parameters, the range slider does not require parameters, as this option is unavailable in the parameter section.
To use this feature, the column’s data type must be an integer, as other data types are not supported. The following are the steps to add a range slider to the controls.
Steps to Create Range Slider
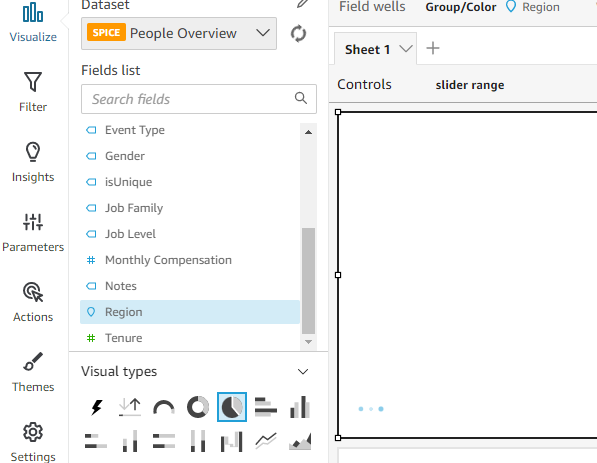
Step 1: In this dataset, we will select the Tenure column as it is an integer and can be effectively used with the range slider.
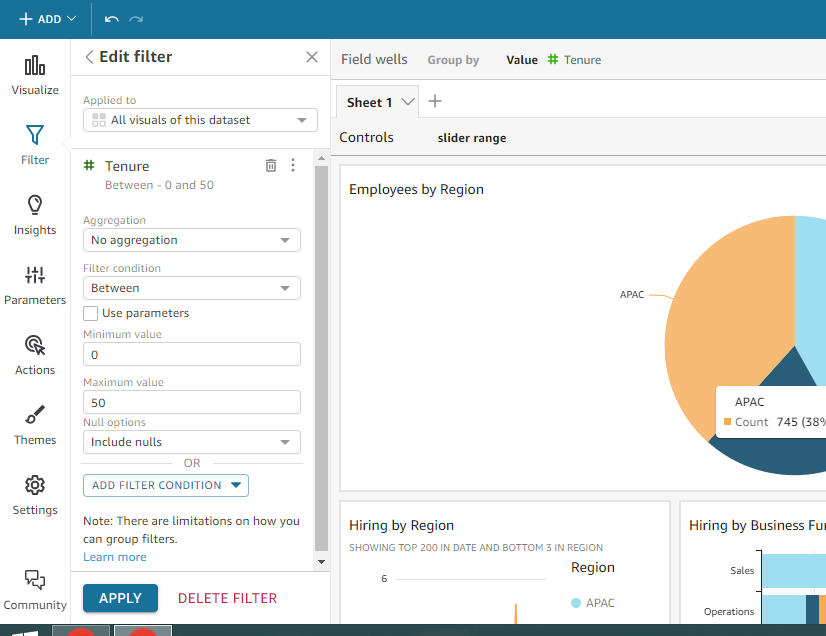
Step 2: Add the same field to the filter pane, set the aggregation to “No aggregation,” choose “Between” as the filter condition, and specify the minimum and maximum values for the slider.
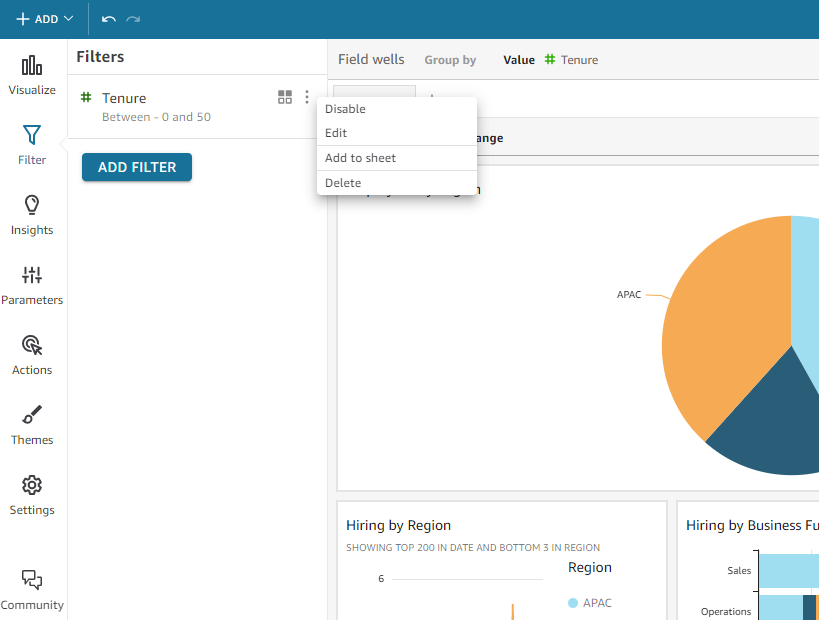
Step 3: Once everything is configured and applied, click the three vertical dots and select Add to sheet from the options. This step adds the control to the sheet, allowing you to reposition it as needed for the control section
Step 4: After selecting Add to sheet, a pop-up for the range slider will appear, allowing you to configure the minimum value, maximum value, and step size.
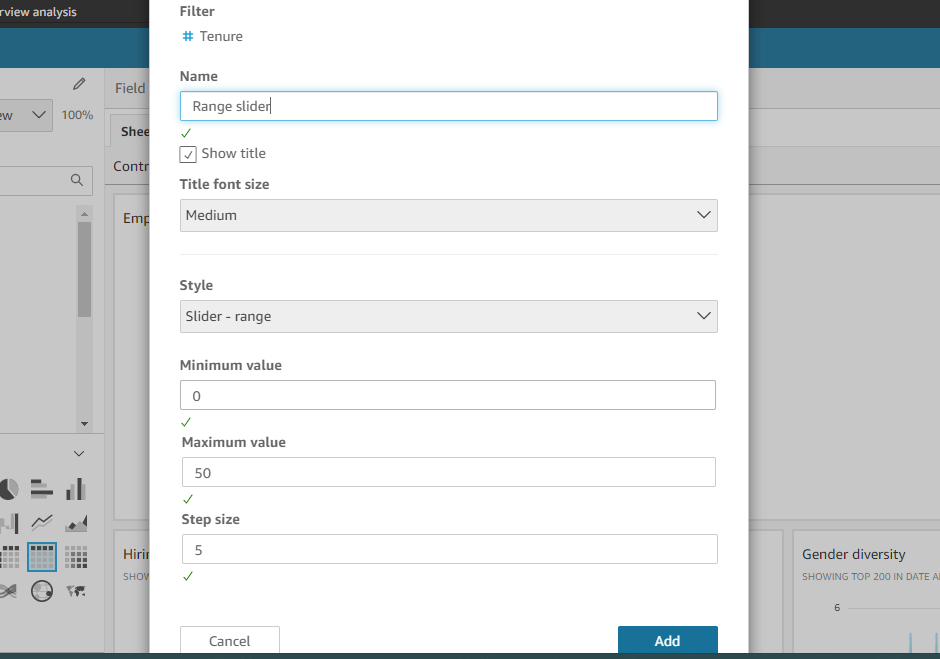
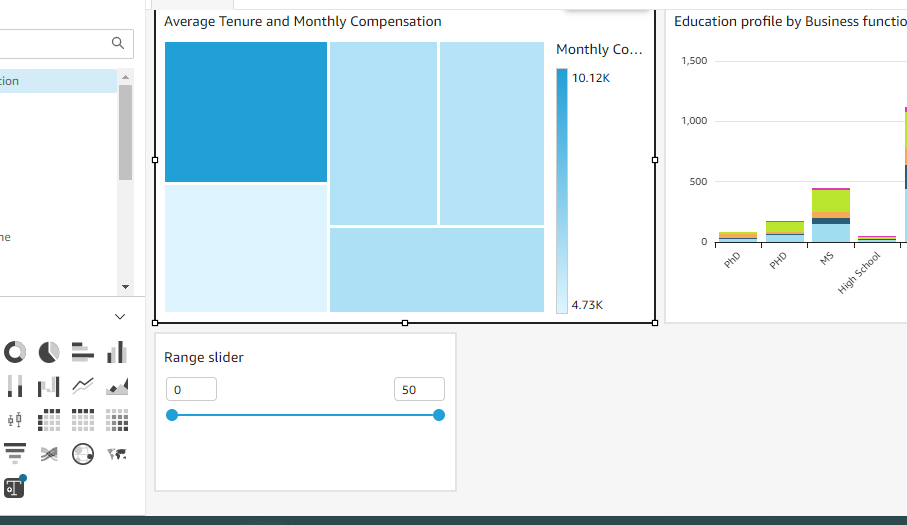
Step 5: After clicking the Add button in the pop-up, the range slider will be added to the sheet, displaying the specified minimum and maximum values.
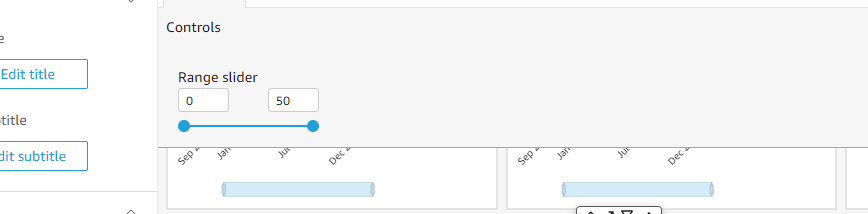
Step 6: In this step, the range slider added to the sheet is moved to the controls section by selecting the Pin to top option from the vertical dots menu. Once pinned, the filter selections will function as intended, providing accurate results based on the selected range in the range slider.
However, the ranges set in the sliders are currently manual. Ideally, the minimum and maximum ranges should be automatically derived from the respective field values, reflecting the actual minimum and maximum values. I hope this explanation helps you implement the range slider more effectively in QuickSight.
Learning is what makes me excited. I have a handful of experience as a data and BI analyst with broad skills across various tools. I am also a person who take up challenges and who work for it untill it get resolved. I have learnt to be spontaneous and precision in problem solving because of the experience over the years.